


01 Jun The Ultimate Guide to Using Key Performance Indicators (KPIs) for Growth: Part 1
On my Twitter page—at least at the time of this blog post—I have an image that shows the contrast between a candle and a light bulb. It’s a simple representation of modern business, and I think the lesson is pretty obvious. The caption next to the candle says, “Yesterday’s growth model” while the caption next to the lightbulb says, “Today’s growth model.”

In today’s world, it’s not enough to stay a master candle dipper at the dawn of electricity. For the older generation of CMO or growth guru, this means that you can’t expect to stay an expert in an outdated craft and then claim that you were born at the wrong time as modern data-driven growth experts effortlessly wield technologies that transform the way marketing and growth operate as a whole. You’re just settling for what you already know instead of exploring new possibilities.
What frequently dooms traditional marketers in today’s market is a failure to understand the mindset of the modern consumer. In decades past, you could get by with billboards, TV commercials, cold calling—anything that put leads into the top of the sales funnel. Now, the empowered consumer has the ability to find multiple products and providers by going online. Just a few years ago, that usually meant using a computer, but more and more, this is done on a mobile device—anytime, anywhere. As a result, the buying process has changed from a scripted experience authored by businesses to a self-guided journey defined by consumers.
So how does this buyer journey work now? The modern consumer—which includes me, you, all of us—goes through a series of micro-moments. That’s right, micro-moments. These small but important touch points come from the decisions we make every day—research, discovery, purchase, and more. These customer-driven micro-moments roll into the larger experiences that are part of a journey, which could be as simple as deciding whether or not a product or service is worth looking into based on your needs and goals, or as substantial as buying a home.
Google nailed the concept of micro-moments. The search giant took notice when they saw more people conducting searches on mobile devices, and tied it directly to everyday consumer behavior. Take a look at this video that illustrates what this concept means (I love this video from @google, by the way).
These micro-moments—and I know this analogy is somewhat of a deviation for a post on KPIs, but stay with me here—are a lot like the electricity that made the light bulb in the first image possible. As technology continues to connect businesses with customers and empower consumers, companies have access to more data on consumer behavior—data that, when properly used, can inform strategy and increase sales. On the other hand, if you overlook these micro-moments and stick with making candles, you’ll find that customers who have better options available will often look elsewhere.
But this post isn’t going to focus on micro-moments. It’s about key performance indicators, otherwise known by the acronym, KPIs. Yet throughout this post, keep those micro-moments on the top of your mind.
KPIs are so important to me—and your strategy—that I’m turning this into a three-part series to cover everything you’ll need to get started. Here in part 1, we’ll establish what KPIs are, part 2 will help you discover what your KPIs are, and part 3 will address how to visualize and present them.
What Are Key Performance Indicators Anyway?
Don’t let the number of syllables fool you—KPIs really aren’t that scary. Investopedia defines a Key Performance Indicator as:
“…a set of quantifiable measures that a company uses to gauge its performance over time. These metrics are used to determine a business’s progress in achieving its strategic and operational goals, and also to compare a company’s finances and performance against other businesses within its industry.”
Simple, right? You choose a metric and then watch how it performs during a campaign, over a fiscal year, or over the lifespan of your business.
Here’s the million-dollar question that makes KPIs matter: How does a growth team get granular enough to measure a customer’s actions so that you can deliver a sublime customer experience? That’s the real purpose of measuring success, which is what KPIs deliver when done right. If you focus on dollars only, you’re missing the entire point of data-driven consumer-centrism. New initiatives will be ineffective and stall out if there isn’t a larger human purpose behind the action.
So, don’t get lost in the terminology here. Just know that KPI is an important term that is used perhaps too liberally, and I’m here to break it down for you.
What KPIs Aren’t
Before you get started on identifying the KPIs that matter to your organization, make sure you don’t get distracted. Some articles try to draw a distinct line between KPIs, metrics, analytics, and other similar terms, and it just gets messy. Don’t sweat the small stuff. But also, don’t be fooled by vanity metrics.
Vanity metrics are data that scratch the surface of what’s happening around your brand, but don’t get even close to telling the entire story. These could include generalized site traffic, social followers, likes, clicks, or any other number that represents a simplistic view of customer activity. These metrics are invariably based on quantitative data—metrics that are easy to collect and measure, reported as simple numbers. If your data analysis is shallow, you can expect insights that are equally shallow.
Wait, am I saying that things like web traffic or social traction don’t matter and shouldn’t be tracked or reported? Nope, I’m saying that these indicators shouldn’t guide your data strategy. Because ultimately, KPIs are only useful when they contribute to meaningful insights towards growth. Heck, I could pay someone to quadruple my Twitter followers within a couple days. Who cares if they’re fake accounts, what matters is that my numbers go up and I look good, right? Wrong. That approach might make you feel good but it doesn’t do anything to fuel your organization’s growth.
Now don’t get me wrong here. There’s a time and place for simple metrics that only scratch the surface. Simple metrics have some value because they show what your customers are doing. Still, they don’t offer any depth or insight into why they are doing it, much less what they’re likely to do next. One example of an over-simplified metric is the net promoter score, or NPS. This has been widely adopted by companies because it’s delivered as a simple, one-question survey that asks, “How likely are you to recommend [company name here] to a friend?” The customer picks an answer between 0 to 10, and that’s the end of it. Promoters—those likely to recommend your product or service to others—will rate a 9 or 10, passives are 7 or 8, and detractors are 6 on down.
So what’s the problem with NPS? For starters, there’s no inherent segmentation or motive discovery involved. Some people even claim that it’s the best KPI available. And yet, if your NPS suddenly drops, how will you react? If a one-question survey is the only way you’re gauging customer sentiment, you’ll be left in the dark. Sure, you’ll probably have some idea of what might be causing the problem, but it will require extra digging that should have been done from the beginning. NPS certainly has a place in understanding customer satisfaction, but it’s definitely not something you should use as a foundational data point.
I get it—finding the right KPIs is hard work. But taking shortcuts early on means you’ll have to work even harder, later on, to make up for it. So whatever you do, don’t equate KPIs with vanity metrics.
Just How Complex Can KPIs Get Anyway?
Not long ago, I sat in a boardroom with several executives at a very large, very successful Fortune 100 company. For a company at this scale, you might think they have all the information and resources they could ever need, and the leaders have the answers to every question about how to stay on top.
Well, I spent hours in that boardroom, presenting a framework for tracking and reporting KPIs. We delved into process flow, data and experience mapping, and even proprietary algorithms. We discussed the role of quantitative data, how those numbers contribute to qualitative KPIs, which KPIs correspond to different stages of the funnel, how to drill down using quantitative and qualitative data blending, and much more.
Now, I’m not saying this to brag or to impress you, and I’m certainly not saying that the leaders of this company needed me to come in and tell them all about the importance of data. But put yourself in their shoes: there’s a lot of competition gunning for your customers and the tried-and-true tactics aren’t working anymore. What can you do to keep your customers around and acquire new ones? How do you use data to consistently produce real, actionable insights?
As you can imagine, there are no easy answers for a large enterprise in this situation. But it’s these types of challenges I sprint toward. I love them, and I geek out over them. I love diving into the numbers to squeeze out growth. That’s right, growth marketing isn’t always a creative, iterative game—you have to have proof of your strategy, and show that what you’re doing is working. And that’s where your KPIs come in.
The best KPIs aren’t ordinary metrics, such as clicks or views. They’re predictive in nature, meaning they enable us to peer into the future and understand what will happen next because, with the right KPIs, we can better understand the customer’s end-to-end experience, starting with brand and offering experience based on—now stay with me here as I use this term liberally—cognitive associations. [As a side note, if you want to know more about the topic of consumer psychology, I’m building a Customer Experience Resource section over at RocketSource, so make sure to stop by and check it out].
As your KPIs inform your understanding of customer behavior, you can more easily ensure your marketing stays on track to help you grow instead of keeping you guessing—hoping that what you’re doing is going to be enough to generate sales and build a loyal tribe of consumers. That’s vastly different from the surface-level metrics that only give you a small glimpse into what’s happening in your customer’s mind.
Getting Started on Your KPIs
So, with so much on the line, how do you find the magical KPIs that will help you predict the future and keep you from guessing? To start, you need to match the KPI with your story, the company vision. In other words, you need the KPI to align with your why. Why are you in business? Why are you doing what you’re doing?
Then, you also need to match your KPI with your goals. Which metrics (yes, metrics) will let you know if you’ve reached your overall goals? Is it sales? Downloads? Signups? Whatever your goal is, there’s a single metric that’s probably attached to it, but this is NOT your KPI. I repeat, this is not the KPI that’ll tell you if you’ve performed because it cannot predict what happened and what’s coming.
With your goals and objectives in mind, you need to start mining the data. First, you need the right systems in place to do the job correctly. Then, you also need the right people in place, the right tools, the right processes, and the right skill sets on board. And, with the right people sitting in the right seats on the bus, you have to start mashing the data together into a single, meaningful KPI. This isn’t done quickly. It requires you to generate your own algorithm, tracking the right metrics at each stage of the funnel and then combining (or mashing) the quantitative data and qualitative insights together to create one metric that tells a strong, predictive story AND aligns with your overall goals and objectives.
Finding your KPIs is hard work. You have to know what to track, when to track “it”, where within the funnel/stage/journey to track “it”, how to do “it”, and how to make the process predictive against improving the CX or UX on the right channels (mobile, desktop, etc.). All of a sudden, “it” becomes a beast.
So what KPI did I focus on with this Fortune 100 company I mentioned earlier? Spoiler alert: We didn’t come up with a single, simplified KPI. After all, how could we when there were so many factors at play? Does that sound familiar to you and your industry? I’ll share what we uncovered further below, but first, let’s talk a little bit about industry and the role it plays in KPIs.
Taking Industry Into Consideration
Before we get in too deep here, I want to pause and make mention of something important. It’s easy to get nervous about the jargon behind KPIs, metrics, and just about everything else in the realm of growth. Don’t get caught up in it all. Jargon creeps its way into our mindset and causes our brains to turn off what’s important. Instead, I encourage you to tune out the buzzwords and tune into what’s happening with your customer’s journey—the micro-moment experiences, if you will. These moments are what make or break your campaign; not a fancy pants buzzword or two. Focus on those, and you’ll win every time.
With that out of the way, let’s look at customer journeys because your industry plays a tremendous role in shaping the very experiences your buyer has with your business. Before you can understand which KPIs you need to track, you need to have a solid understanding of what your buyer’s journey looks like. Let’s take a closer look at some of the larger industries to nail this point home.
SaaS
SaaS (or software-as-a-service) turns much-needed services into software products. For example, project management software, like dapulse, can take the tedious tasks off of a project manager. Email marketing software, like ConvertKit, can simplify and enhance the way you use email to target your clients.
Bottom line—the product is unique in that it’s both a service and an end product, which makes the buyer’s journey unique, too. That means that the KPIs for the SaaS industry will be different from your average product-based sale. There’s more complexity to them. The way people arrive at the checkout page is different. The way people engage with the product is different. So, how you track that engagement will differ as well.
SaaS products are well-known for their off-the-charts growth patterns, and that’s not by accident. They do it by creating a stellar brand, valuable content, and by giving away a lot for free. But each of those steps happens in its unique stage in the customer journey. To illustrate this further, take a look at this customer journey map for a typical SaaS product from Pijush Gupta.

One quick glance and this might seem like a relatively straightforward route to purchase, but it’s not. Gupta does a good job explaining that each stage of the customer’s journey is disconnected from the next. This is especially true in the B2B industry, where most SaaS products live.
From a KPI standpoint, this might make it seem like it’s easier to understand which metric to monitor. You just need to figure out which campaign pushed the buyer over the edge and into the next bucket in the customer’s journey toward purchasing, right? Not quite.
The first step of buying a SaaS product is to learn about the product. During this phase, potential users are getting emails, visiting websites, and looking at reviews on social media sites. There are numerous touch points in that one stage. Then, if the customer decides she’s interested, she will enter the “try” phase. Here, she’s again experiencing numerous touch points, including emails from the company, features in the product, and (most likely) visits/contacts with the help desk or live chat. So, within each bucket, there are numerous areas that need to be monitored and tracked. Which one pushes the customer to the next stage? It’s unclear unless you have the right KPI in place to ensure it’s not just a gut feeling.
Finding KPIs is much more complex than choosing a singular metric for each bucket. If you’re going to get a solid understanding of your customer’s past, present, and future behavior, you need to track engagement. Where do people engage? There are so many forms of engagement, how do you know if you’re tracking the right form? Or, should you take an average of each type of engagement? What’s the best way to mash up all of the data available to you through a SaaS product and put it wrap it neatly together into one metric that’ll tell you exactly what you need to know to predict future customer behavior and shape your marketing? It’s this type of data mashing, the analysis that needs to happen in order for you to find the best KPI for a SaaS product, so you can grow.
eCommerce
The eCommerce channel is a little bit different from SaaS in that the customer gets a tangible end product, but that doesn’t make the customer journey any less complicated, nor does it make the KPIs easier to track. Monitoring sales alone (as many commerce businesses do) isn’t enough. It doesn’t tell you about the experience the customer is having, which means you have no way of predicting what future behavior will look like. You’ll continue to guess your way to growth, which isn’t a growth strategy at all.
To illustrate this point, take a look at this breakdown of a standard customer journey (experience mapping) from Adaptive.
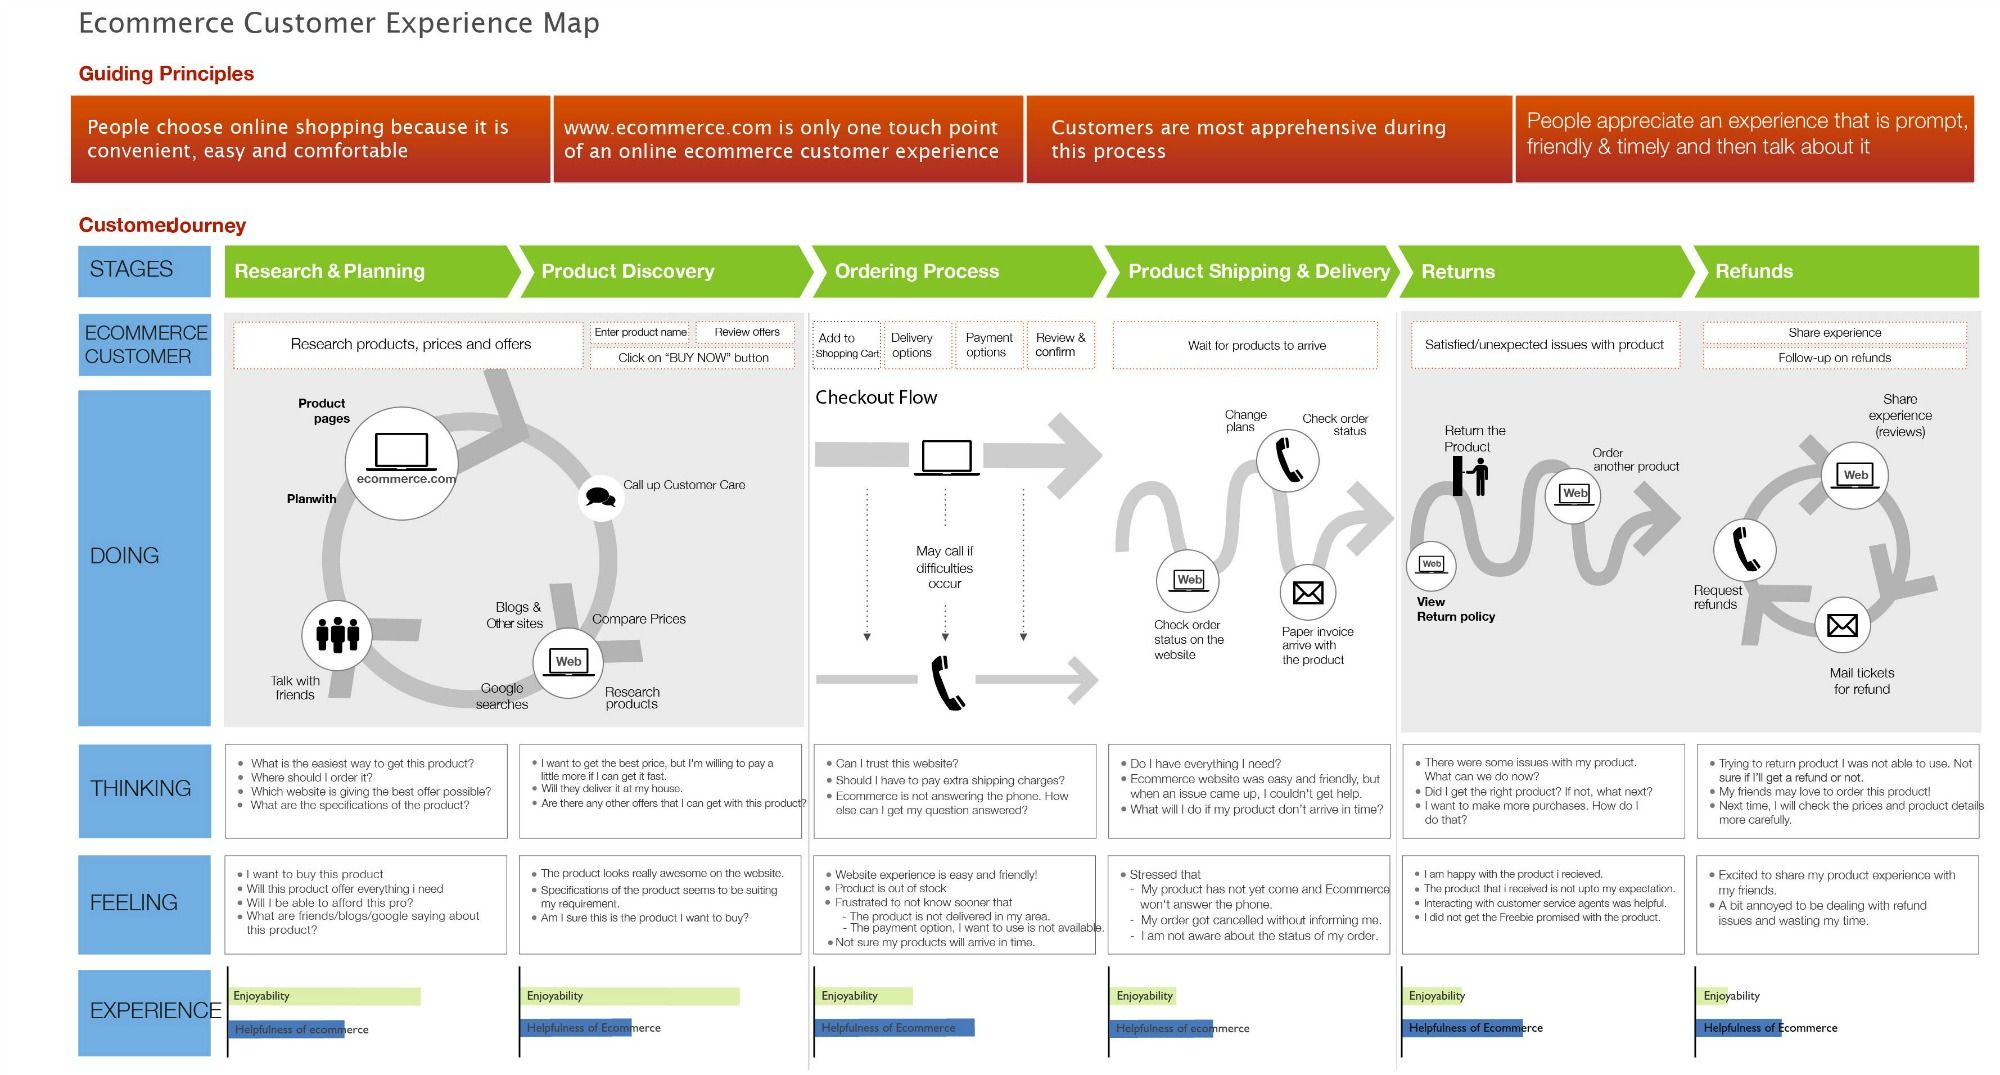
Sure, the stages of the customer journey look similar to SaaS—but the process is a bit different.
In the first few stages, many customers go around and around researching the tangible product in-person and online. Once they’re sold on the product, they’re ready to start engaging with the company but might not be willing to whip out their wallets just yet. They email, talk to customer service agents and continue analyzing whether the product is right for them. Then, they finally buy. But during the purchase process, they’re on the hunt for a coupon hidden somewhere online, or a lower price from a competitor. Then, they buy the best deal for them.
There, again, are many touch points and many opportunities to make or break a conversion. Knowing which metrics you should monitor to understand which opportunities you are missing and which you should continue capitalizing on is confusing at best. Instead, you can mash this data together to create your own algorithm that’ll come up with a KPI that paints a more detailed picture and gives you an accurate way to predict why a customer took a certain action (put an item in their shopping cart, put another item in their shopping cart, go through with the sale, write a review, etc.) and what’ll get other customers to do the same going forward.
Insurance
It’s a service! It’s a product! Nope, it’s again something unique—insurance. There’s no hiding the fact that insurance is a unique industry. The deliverable is unique in that most people don’t need to use it (or use much of it). It’s a service in that you’re working alongside an agent to help you get the funding you need when you’re hurt, sick, or have a damaged home. It’s a product in that you buy a policy or package to determine what level of coverage you receive. So, in essence, it’s not your usual buy, and that means customers take a unique path when trying to find the right policy to protect them and an agent to work with for that protection.
To hit this point home, take a look at this image of the typical customer experience when buying health insurance from Forrester Research.

Here, you can see that buyers go through several stages when engaging with an insurance company. First, they look online. Then, they get on the phone with a customer service agent. Then, they purchase their product from someone else entirely. To use it, they engage with a health service provider. To ask questions, they’re back on the phone with a different customer service agent. And in the end, they’re on the health insurance company’s website tying up loose ends.
That’s a lot of touchpoints for an already complicated buying process. How can you know which touchpoint converted a shopper into a buyer? What if multiple touch points swayed the customer to go with one insurance company over another? What about loyalty after the purchase? Which experience made a shopper more loyal? Was it a combination of ease-of-use on the website and an active interaction with the customer service representative?
It’s this kind of omnichannel approach that makes it difficult and downright confusing to know which KPIs you should be tracking. You don’t want to pay attention to one channel and ignore the impact another had, or you could be missing out on some valuable opportunities.
Speaking of an omnichannel approach, let’s take a closer look at all of the businesses in that realm.
Omnichannel
Remember the Fortune 100 company I was working with on the growth strategy? They are a large retailer with about a dozen different affinity channels including B2B and B2C. With so many different avenues, we had to consider the numerous ways a customer could (and likely would) hear about and interact with the brand. If we only tracked one channel, we wouldn’t know the weight the other channels had in bringing the customer to the landing page (or point of purchase, or whatever the end goal may be for your project). Ultimately, we took the weighted average of the key engagement factors from each channel and came up with a proprietary engagement KPI.
For example, for email marketing, I advised the company to use Litmus (which you’ve heard me talk about before in my post about building a modern marketing team). The reason why I’m such an advocate for this email marketing software is that it lets you track engagement scores. These scores are created based on how far a person scrolls into the email, whether they print the pages, forward the emails, etc. That gave us one score, but what about the other channels?
By looking at their online user usage and behavioral data points and within the Engagement KPI, I knew that the Engagement KPI could be strengthened with some additional work:
1) Assign a quantifiable number to user heat maps and video recordings;
2) Assign a scaling quantifiable number for increasing Time on Site (ToS)
3) Assign user scroll depth a larger emphasis on the weighting against the more commonly used metric of time spent on each page.
With any content initiative for an Omnichannel brand, these points can uncover which pages and which pieces of content/utility have the highest correlation to effecting a positive ROI. In a nutshell, we want engagement. We want to capture people’s attention and time—especially for more complex purchases.
There were plenty of other channels, and I won’t go into each one because they’re all different for each company. What’s important is that, if you’re an omnichannel company, you look at every touchpoint and channel used to engage your buyers in your business from brick to click—otherwise from end to end. Then, you can take a page from this Fortune 100’s playbook and create a customized data model that is centered around your customer. This type of KPI will not only give you far greater insight into what the customer is actually feeling, thinking and doing, it will also help you bridge any silos that exist within your company.
Remember, engagement is king nowadays. If you’re operating your company in an omnichannel industry, you’re marketing to your customers in numerous places because you know that’s how they shop. To nail this point home, take a look at this graphic put together from survey results from Ipsos and Google (found in this presentation about omnichannel pain points in retail from Gravity Thinking).

The survey here was specifically about holiday shopping, but ordinary shopping isn’t too far off either. Most customers will do some product research both online and offline. For your business, you need to understand what type of engagement is happening across the board. This engagement will help you determine the success of your marketing and customer experience campaigns. Weighted averages of key events are just one way to nail down engagement.
Phew! We’ve come a long ways, haven’t we? And we’ve only just touched the tip of the KPI iceberg if you can believe it. That’s why I’m turning this into a two-part series, with a third bonus post. For part one, I’m really working to give you the overview of why KPIs are so important. In part two, I’ll dig deeper into how to find the right KPIs for your business. In the third, bonus post, I’ll introduce you to the world of marketing dashboards (and you’ll wonder how you ever lived without them).
But for now, let’s close out this post with a primer on how to build a KPI system. That’ll be enough for you to digest in this first sitting before we get deeper into things moving forward.
How to Build a KPI System
By now, you’ve probably realized that tracking down the right KPIs requires turning the funnel upside down. You can’t continue following one-off metrics and expect to get the big picture. To discover new opportunities, you need to get deeper into the trenches to find the metrics that’ll paint a more accurate image of what’s going on with your buyers.
There are more (way more) KPIs that you can track for every channel and every unique customer journey beyond the weighted average of engagement. I dig into that in part 2 of this series, but let me leave you with this first to get you started as you think about your own KPIs and what you should be monitoring for your business. This is the system that’ll get you started toward understanding why you’re in business and what you’re truly trying to track based around the CX.

Step 1. Define Your Goals
With some sort of an end goal in mind, you can start looking at your ultimate near-term goals. What do you want the customer to do? What do you want the customer to think of the brand or the experience? What action do you want the customer to take? Of course, the easy answer here is to buy. After all, to grow you need sales, right? But in some cases, the action might differ. For example, your goal for your loyal users might be to leave you a positive review or to share your business. Or even become a new brand ambassador to influence other like-minded brand advocates.
To find your growth-oriented goals, look first to the online experience. Dig into the user flow on Google Analytics. This will tell you how your customer is experiencing your business, your sales pitch, and (most importantly) their journey. Focus relentlessly on the customer’s experience overall and you’ll find areas where you can improve.
Then, with the CX in mind, think carefully about your overall goals for each stage of the customer journey. These goals will help create a KPI system that’ll let you discover new opportunities to reach these goals.
Step 2. Define Your Objectives
Too often, when determining KPIs, businesses start low-level. They look at the easy metrics to track, such as open rates, impressions or click-through rates. These parameters can add a little color to your business’s picture, but they aren’t enough to bring opportunities to life.
So, companies up their game a few notches and look closer at the mid-level metrics, such as conversion rates on landing pages and in email campaigns. Although this adds a little more color to your business canvas, it’s still not definitive of how the customer engages in your marketing.
I’m a big advocate for what I call the North Star metric. In its most basic sense, this is your high-level metric that should guide every decision in your business. It’s your beacon to steer you home when you get overwhelmed with all of the decisions you need to make to grow your business. Although high level, it’s the right place to start.
You can think of your North Star metric as a metric tied to your business’s why. This is why you decided on this company (or why the founders created this company). This is the core reason for why you’re in business. It’s your vision for the future. It’s WHY you exist. This is also why you build out the systems, put the right people in place to manage these systems, build the products and services you do, push your marketing message out to the various channels, and start the experience. It all comes back to the WHY.
This is a far more emotional step than people give it credit for. The “why” of your business must match the emotional and logical “why” of your customers.
Your North Star metric needs to keep the two “whys” aligned.
Here’s another way to think about it. When a person starts researching your products or services she has an emotional response to what you offer. This is a culmination of her past, present, and future experiences. For example, she might see a pair of red shoes and think, “I love the color red.” Then, she’ll go to her logical side of the brain and start thinking, “is this worth my investment? Do I really need these shoes?” When she finally hits the buy button, a wave of endorphins are released and she starts immediately considering whether she made the right decision. She goes back to her WHY. Why did she fall in love with those shoes and make the purchase? Your North Star metric needs to align with that same WHY.
The North Star metric is the “aha moment” (TRIGGER MOMENT) your customer has when working with your business that gets him or her to buy. This moment is what truly captures your ability to grow, so it makes sense to start here when deciding what to track. A few examples of KPIs that get deep on this is brand trust, awareness or recall lift, and click-through rates.
What is your North Star metric? What will make your buyer stick around when it’s time to pull out their wallets and buy? What’s the emotional reason for the purchase and how does that align with why you’re in business? What’s your objective?
Step 3. Determine How to Reach Your Objectives
So, you’ve decided that you want to increase brand trust, or build recall lift. To do this, you need to uncover the best strategy (or strategies) to make your objectives a reality.
Before you decide on a strategy, look first at the customer’s perception and your overall marketing performance. Where are the gaps? How can you strategically show up in the right place at the right time to change up the perception while boosting your marketing performance? The answer to this will give you a clear idea of the strategies you need to take to reach your objectives and ultimately your goals. I’ll talk more about this in part two of this series, as it’s a critical step.
Step 4. Choose Your KPIs
Ah-ha! Were you wondering when I was going to get to KPIs? Well, we have arrived. But I won’t go too deep here. All of the data appending/coupling/mashing that needs to be done is complex and advanced enough that it deserves attention all of its own. These words might sound like jargon (and they are) but they’re important to understand. To go into detail on each of them would require a post in and of itself, but for now, let me leave you with a few links where you can explore more on the topic.
Data coupling or data appending in its simplest form is appending (adding on to) data to your marketing efforts. For example, Facebook appending adds on target audience information, such as location, demographics, etc. Google Adwords also offers data appending. If you’re using any of the popular platforms, like Facebook or Adwords, appending data gives you more information about your customers, which can help you get a much deeper understanding of the overall CX, your customer’s why, etc. When you know more about your users/consumers/clients/customers/etc, you can segment and customize messages and experiences based on their micro-moments within their overall journey. All of these factors are important when choosing your macro and micro KPIs.
Like I said, there’s a lot more that goes into this and how to use it, but for now, I’ll let you chew on this:
Your KPIs must be modern and meaningful. For example, instead of looking simply at the number of impressions your ad received, you should dig deeper and look at the view-through rate. Remember, surface-level metrics aren’t a sufficient KPI for your organization. You need KPIs that give you a real glimpse into what’s happening with the buyer’s experience with your brand. This type of KPI is marketing gold. And these are the measurements that will propel your business forward.
Again, this is a high-level overview, but we’ll be covering this in much more detail in our second post in this series on the importance of KPIs.
Step 5. Choose a Platform
There certainly isn’t a shortage of technology that businesses can use these days to automate, track, and tweak. Based on your industry, your business size, etc. you can use platforms that cater to small businesses or enterprises to measure what you need to know to enhance your customer’s experience. Tech stacks—the technology platforms which underpin your customer-centric analytics strategy—are key to your efforts, so select your tools around the core of your business and the core of your customer and avoid a “one size fits all” approach.


You can see that there are a variety of options to choose from. Choose what’s best for your business goals and objectives, and if you don’t know which platforms will best fit within your company’s structure, feel free to reach out.
Still not sure? If you’re new to this, your head might be spinning now, but I will get much deeper into this piece of the puzzle in the second post on KPIs and the third post about marketing dashboards.
Step 6. Build an A/B Optimization Plan
Data gives us a very accurate picture, but data should inform. It should never take the place of creativity, user experience, the user interface, utility, content development, etc. It should reaffirm what you’re doing rather than replace the artistic side of marketing. To do this, I recommend setting up a way to do A/B testing.
You’ll hear me say this a lot. Clean data in means clean data out. Dirty data in means dirty data out. What I mean by that is this: If your data gives an accurate description of what’s happening, it’s clean. But, if other factors creep into the data, you could end up with dirty data, which can paint an inaccurate description of what’s happening on a page.
Take heat maps for example. They show where people click, where people linger, what’s capturing the attention of the visitor on a website or landing page, right? They’re useful, but they shouldn’t always be taken at face value. What happens when you see someone stopping and lingering around a certain button for a long time. Are they interested? Debating the sale? Or could they have been temporarily distracted by a toddler pulling at their leg/taking a quick phone call/making a quick bathroom break? This can be dirty data because it doesn’t give you the full insight into what’s really happening.
In growth marketing, you have to make assumptions and test on those assumptions. A/B testing lets you do this by making small tweaks to your marketing, product development, etc. It lets you quickly get a peek if you’re working with clean data or dirty data (okay, I realize that last sentence is wayyyyy oversimplified but you get the point). It also makes it so you never take the creativity out of your business development efforts. You’ll use innovative methods to approach integrating data into development, just like we do on a daily basis over at RocketSource. It’s worth going through this extra step so you can get more accurate insights, which will help you as you surge ahead toward growth.
Step 7. Create a Timeline
With your objectives, goals, and KPIs in mind, start putting a timeline behind your actions. When do you need to achieve your goals to keep your business moving ahead with upward momentum?
Growth doesn’t happen overnight, but it doesn’t have to take years to complete, either. By setting up your timeline, you’ll have a stronger measurement and reporting system. It’ll give you something to work toward. It’ll also help you outline the specific numbers your business needs to see to continue moving forward. This, my friends, is growth marketing at its finest.
Step 8. Improve, Iterate, Repeat
Congratulations! You’ve put your plan into motion toward your objectives and goals. Your work is done, right? Not quite.
Growth marketing is a constant game of iteration. The minute you stop analyzing what you’re doing, you’re dead in the water. You’re not growing, you’re sinking or floating. Like with any marketing piece, it’s important that you continue to improve, iterate, and repeat your KPI measurement and tracking plan just as you would any of your marketing plans.
Wrapping Up Part 1
Did this whet your appetite for KPIs? I hope so.
KPIs are often ignored as simple measurements or metrics when they’re anything but. In today’s world, where customers live and breathe in micro-moments, the way you track engagement and customer interaction need to reflect this new behavior. KPIs need to become an integral part of your strategy. You can’t just rip these up. You need to be strategic about them.
In the next post (coming soon), we’ll dive into the types of KPIs you should be choosing for your business. If you thought the weighted average for engagement was eye-opening, you’re in for a treat. Stay tuned!
Want More Insight Right Now? Check Out Some of Our Curated Learning Paths.
Personally Curated By:

Buckley Barlow
Founder, In The Know. Growth Advisor, Investor
Personally Curated By:
Buckley Barlow
Founder, In The Know. Growth Advisor, Investor
Personally Curated By:
Buckley Barlow
Founder, In The Know. Growth Advisor, Investor
calfre2020
Posted at 10:06h, 03 AugustVery nice post. I simply stumbled upon your article and wanted to say
that I’ve really loved surfing around your blog posts.